


You’re not imagining it — they really do grow overnight. Use this interactive CDC height percentile calculator right now to see exactly where your child lands on the official growth curve.
CDC Height Percentile Calculator
As soon as you fill in the fields, the tool spits out a Z-score and translates it into a human-readable sentence. No math degree required.
How to Use This Height Percentile Calculator
Seriously, it’s painless — I’ve watched anxious parents turn into percentile whisperers in under 30 seconds. Just follow these three steps:
- Pick the right tab: Choose boys, girls, or baby (0-36 months). The CDC separates these for good biological reasons — more on that in a moment.
- Enter age, sex, and height: For kids 2 years and up, use standing height in feet and inches. For infants under 24 months, enter recumbent length (lying down) if you have it. The tool is calibrated to the exact CDC stature-for-age datasets.
- Read the result: You’ll see a percentile number and a plain-English summary. That’s it. No decimal-point paranoia required.
Understanding Your Child’s Stature-for-Age Percentile
Here’s where I’ll save you from a 3 a.m. Google spiral. Because who doesn’t love a good percentile panic? I’ve been there — refreshing the CDC’s official growth charts PDFs like they held the secrets to the universe. They don’t. But understanding the numbers? That’s gold.
What Does the Percentage Mean?
Let’s keep the math as simple as a pediatrician’s crayon drawing. If your son is in the 75th percentile, he’s taller than 75 out of 100 U.S. boys his exact age. If your daughter is in the 30th percentile, she’s taller than 30 out of 100 girls her age — and shorter than 70.
That’s it. Percentile doesn’t mean “percentage of ideal height,” and it definitely doesn’t work like a school test where 90% is an A. A 95th-percentile height isn’t “better” than the 50th; it’s just a statistical snapshot.
Healthy Growth Ranges vs. Clinical Concerns
Most pediatricians breathe easy when a child tracks between the 5th and 95th percentiles. That’s the healthy range — the fat middle of the bell curve.
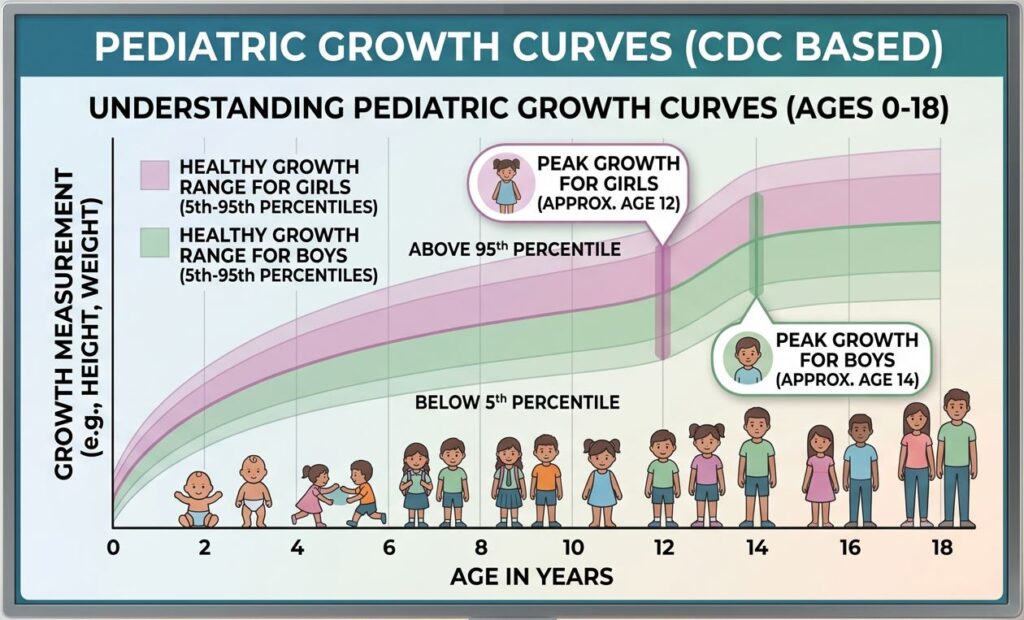
But from a pediatric perspective, a single data point is almost useless without the trend. Clinicians would rather see a kid consistently hugging the 10th percentile line over three years than one who plunged from the 80th to the 30th in six months. Crossing percentile lines — especially two or more major curves — is usually what makes a doctor sit up straighter. Think of it like a stock chart: the trajectory matters way more than today’s price.
That said, extremes do get attention. Below the 3rd percentile or above the 97th can flag conditions like constitutional growth delay, genetic tall stature, or something trickier like endocrine dysfunction. But genetics plays a starring role. A 6’4” dad and a 5’10” mom? Their kids will probably ignore the 50th percentile like it’s last season’s meme.
CDC Height Percentile Calculator for Girls vs. Boys
If you’ve ever searched for a CDC height percentile calculator for girls and then switched to boys back to back, you might’ve noticed different results for the exact same inches. That’s not a glitch.
The CDC separates growth charts by sex because puberty, bone age, and growth velocity unfold on totally different timelines. Girls generally hit their peak height velocity around age 12; boys lag until about 14. By early adolescence, a girl in the 50th percentile might temporarily tower over a boy in the same percentile. That’s normal — and the separate charts prevent endless “Is my son short or is my daughter just early?” panic. The split is a biological feature, not a statistical inconvenience.
Infant and Baby Growth: 0 to 36 Months
If you are looking for a CDC height percentile calculator for your baby, I see you — exhausted new parents measuring tiny bodies on living-room floors. Infant growth is its own beast, and the first two years follow a rhythm that can make even seasoned parents question their genes.
Standing Height vs. Recumbent Length
Here is a crucial detail many parents miss: recumbent length. For babies under 24 months, the gold-standard measurement is taken lying flat with knees pressed gently down. It can add up to 0.8 inches (2 cm) compared to standing height, because gravity hasn’t had its say on their spine yet.
Once a child can stand reliably, clinicians switch to standing height. If you accidentally input a standing measurement into a baby chart, you might see an artificial dip that sends you down a Dr. Google rabbit hole. Don’t do that. The calculator knows the difference — use the baby tab for lying-down measurements, and the big-kid tabs for upright ones.
CDC vs. WHO Growth Charts: Which Should You Use?
I love this question because it reveals how smart parents are now. The confusion is legit. Here’s the official U.S. recommendation in a tight, no-fluff breakdown:
| Age Group | Recommended Chart | Why It’s Used |
| 0-24 months | WHO growth charts | Based on healthy breastfed infants from six countries, establishing a standard for how growth should look under optimal conditions. |
| 2-20 years | CDC growth charts | Representative U.S. sample showing how kids actually grow in the States, including all feeding types and environmental factors. |
The CDC itself endorses this split. For babies, the WHO charts are a prescriptive ideal. For kids and teens, the CDC charts are a descriptive reality. The calculator here defaults to CDC for ages 2-20 and gives baby measurements against the appropriate CDC stature-for-age reference. But if your pediatrician uses WHO for infants, don’t panic. They’re both evidence-based, and the differences are usually tiny. It’s like arguing over two nearly identical coffee roasts; I care more that you’re brewing it daily.
Frequently Asked Questions (FAQ)
There certainly is — but right now you’re on the height tool. If you want to pair stature with kilos or pounds, head over to our [insert link: Weight Percentile Calculator] (it handles BMI, too). That’s where we tackle the classic “is my kid underweight or just lanky?” debate. Together, height and weight percentiles tell a much clearer story.
Pediatricians typically measure at well-child visits — that’s yearly after age 2. Measuring more often is like checking your 401(k) every hour: you’ll see noise, not a trend. I get the temptation, but a quarterly backyard measurement with a pencil and a doorframe creates more anxiety than insight. Let the official growth curve do its slow magic.
You can take an educated guess — and many parents do, because we’re all amateur fortune tellers. The classic method: double a boy’s height at age 2, or a girl’s at 18 months. The more clinical approach is mid-parental height: average both parents’ heights, add 2.5 inches for boys, subtract 2.5 inches for girls.
Neither is a crystal ball. Percentile tracking gets you in the ballpark, but puberty timing, nutrition, and sleep will write the final chapter. I’ve seen kids exit the 25th percentile and land solidly at 5’11” when late-blooming genetics kicked in. Trust the trend, not the fortune.